August 2020: Week 1
Edition #005 - Data recap of last week's big moves inside the Tech ETF landscape. See what to keep an eye on for the week ahead.
Thanks very much to everyone who’s joined FinLister Weekly this week, we broke through 100 subscribers after last weeks July Recap. So thanks for all your support. Last week’s open rate was 51% which was great to see you all actually checking it out, with one great reader checking it out 116 times!!

Weekly Changes:
Out of 114 Tech ETFs analysed the average ETF had a positive week last week, gaining on average 1.27%.
Although, the S&P 500 outperformed Tech with a rise of 1.9%.
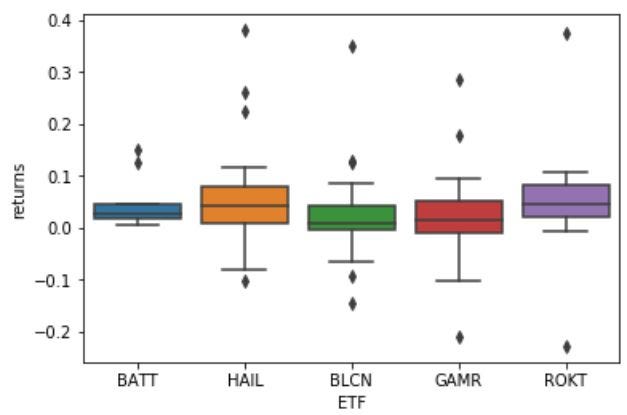
Despite this general under performance, the Top 5 had a relatively strong week, with all ETFs gaining 5% through the period. Alternative Tech saw the major strength of the week with BATT (Amplify Advanced Battery Metals and Materials ETF) leading the way.

The top 5 US based stocks from those ETFs was relatively well mixed. Despite being the top ETF, BATT didn’t contain any of the top holdings.

Out of 33 total positions BATT only has 10 listed in the US, suggesting the strength of its returns came from foreign listed companies.

All 5 ETFs were regular (non-inverese) and non-levered ETFs which is impressive.
Although Levered TECL (Direxion Daily Technology Bull 3X Shares) was in 6th.

On the bottom end, it was somewhat surprising to see WCLD (WisdomTree Cloud Computing Fund) in the mix due to their strong YTD performance, but perhaps some pullback was inevitable.

Similar to the Top 5 stocks, the bottom 5 from the top ETFs were well split, with BATT avoiding all.

$SPCE (Virgin Galactic) led the fall after reporting earnings (a loss of $0.30 and no revenues), updating its timelines for commercializing space travel to later in 2021 at the absolute earliest, as well as trying to raise $400m to continue funding the company. Despite this drop to $18/share, you have to keep in mind that the company did go public (through a SPAC and not IPO) in October 2019 at $11/share.
Year-To-Date:
Of the 107 ETFs which have been around YTD, the average return sits at 18% (up from 11% two weeks ago) compared the S&P 500 which also had a strong past two weeks as it is now much more comfortably inside positive territory at 4.1% YTD.
The constituents of the top 5 saw a small change. WCLD fell out of the top 5 and now sits in 7th spot with 55% YTD returns. Meanwhile ARKF climbed its way to 4th, overtaking OGIG, ESPO and WCLD in the last two weeks. Making it also the 3rd ARK fund in the top 5.

The best performing Inverse ETF is still REW, which extended its losses to be down -57%

On the other end of the table the bottom all 5 ETFs had largely negative week due to the bullishness of the market (despite some volatile tech moves on Friday).

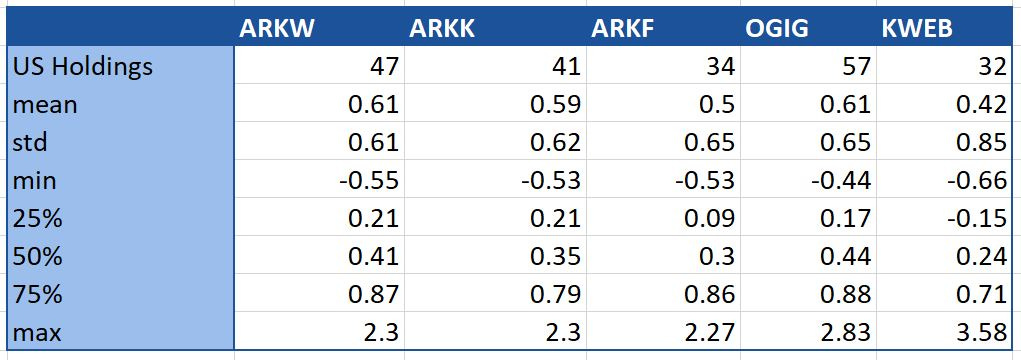
Splitting the top 5 ETFs into their holdings, ARKW and OGIG currently habe the highest mean (on 47 US holdings compared to OGIG 57). CWEB (2x levered KWEB) is able to perform strongly with 42% mean return of its 32 US holdings.

Given WCLDs drop out of the top 5 ETFs, the top 5 US listed stocks from this cohort saw a couple of changes. Despite it’s large amount of Short Interest, GSX climbed into the top spot, with ecommerce company $W (Wayfair) and gaming $SE (Sea LTD) making their first appearance in this group.

However, the bottom 5 stayed the largely the same and in the same order ($JCOM was not in this cohort so $LX (LexinFintech out of China) made the list.

Thank again for reading and hopefully you have a bit more information to arm yourself with for this upcoming week. Hopefully you all enjoyed the July recap and I’ll look to do something similar for August as well, with a twist or two.
Feel free to comment on what you’ve seen above and what else you’d like to see as well as share this email with anyone who you think might find it interesting.
If you haven’t already subscribed, that would mean a lot to me.
Best,
Stuart


