

October 2020: Week 4
Edition #016 - Data recap of last week's big moves inside the Tech ETF landscape. See what to keep an eye on for the week ahead.

Despite a positive first few days of trading last week, the tech market did have its second consecutive negative week, after three positive weeks in a row.

Weekly Changes:
Out of 114 Tech ETFs analyzed, the average Tech ETFs fell just under 1% through the week.
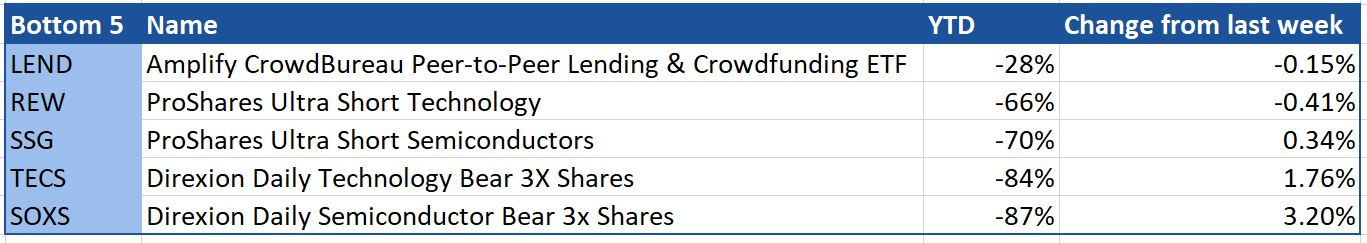
Given the negative week it’s not surprising to see that 3 of the top 5 Tech ETFs were inverse ETFs with $TECS (Direxion Daily Technology Bear 3X Shares) leading the way with a 8.44% gain.
Compare this to last week where $SOXS (Direxion Daily Semiconductor Bear 3x Shares) lead the way with a 3.2% gain. And $SOXL (Direxion Daily Semiconductor Bull 3x Shares) running up a huge 21.15% the week before that.
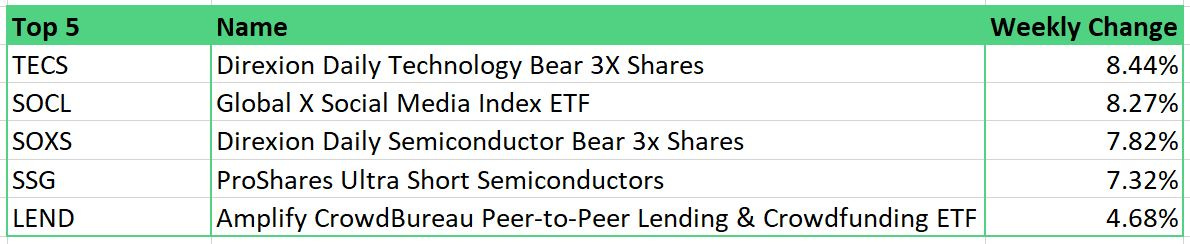
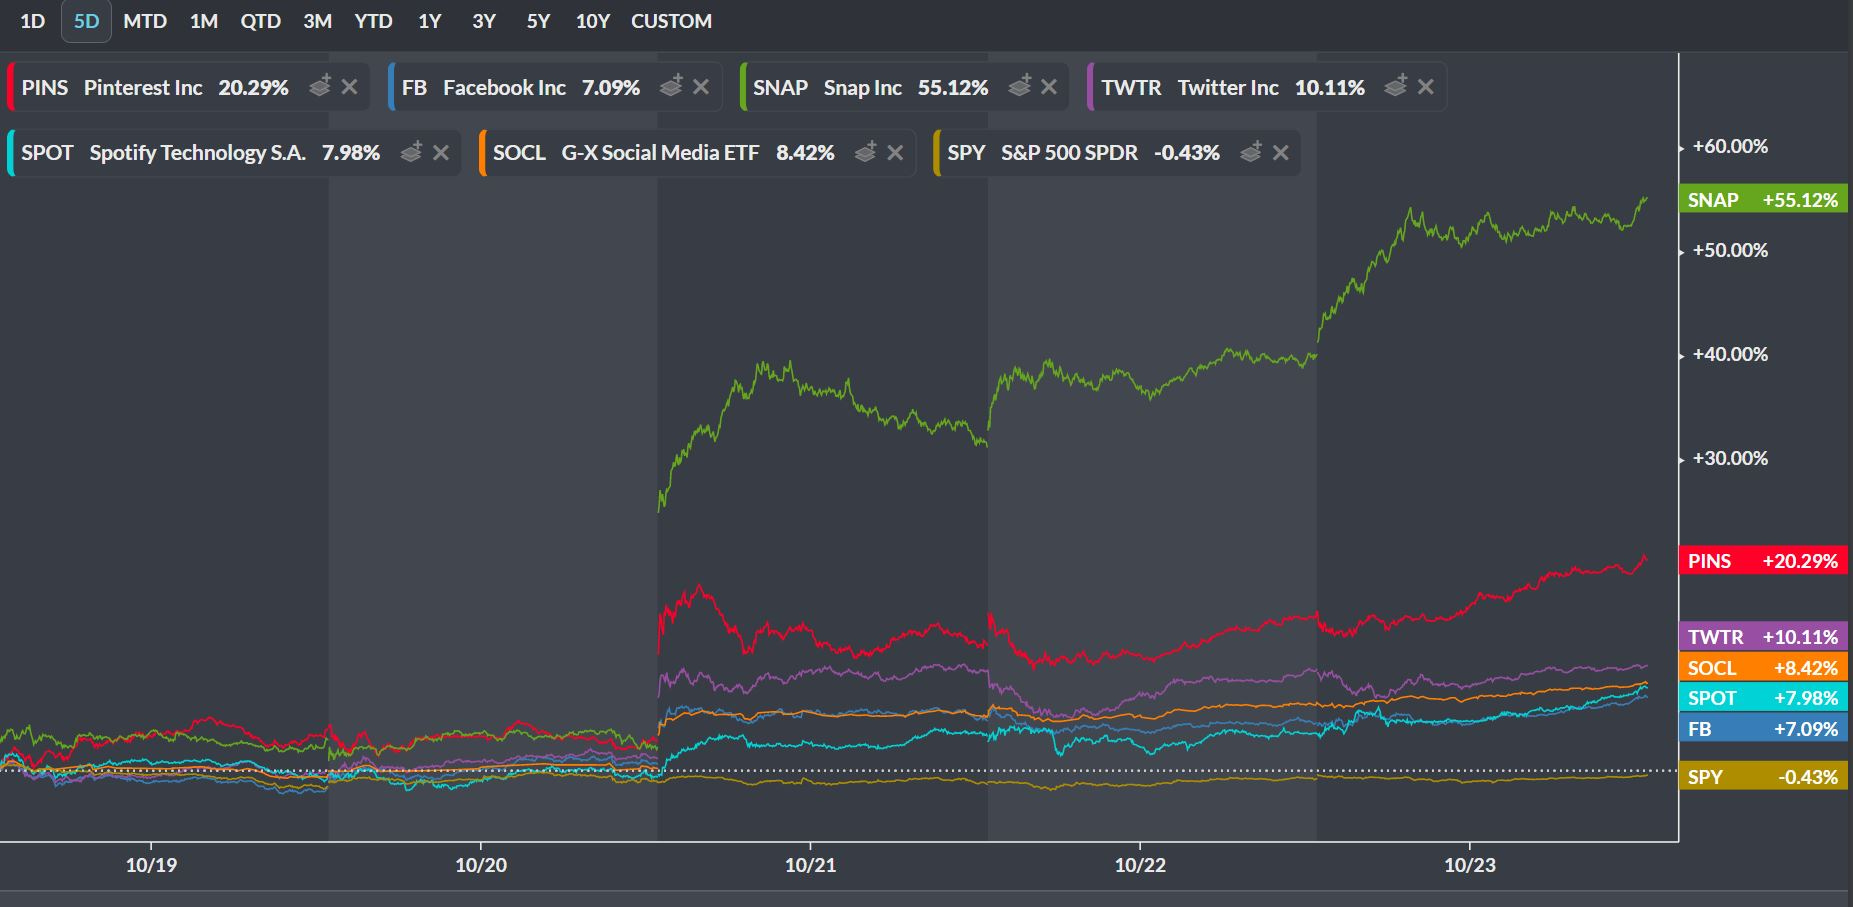
Despite the strength of the Levered Bears, we do see $SOCL taking a run at the top spot.
Largely thanks to $SNAPs (Snapchat) big week which saw it rally past its all time high to $43.13 thanks to a 52% gain through the week off of the back of positive earnings and a couple of the social networks quickly followed suit.
Even with these strong moves from within $SOCL, $LEND (Amplify Crowd Bureau Peer-to-Peer Lending & Crowdfunding ETF) top stocks had a stronger week.
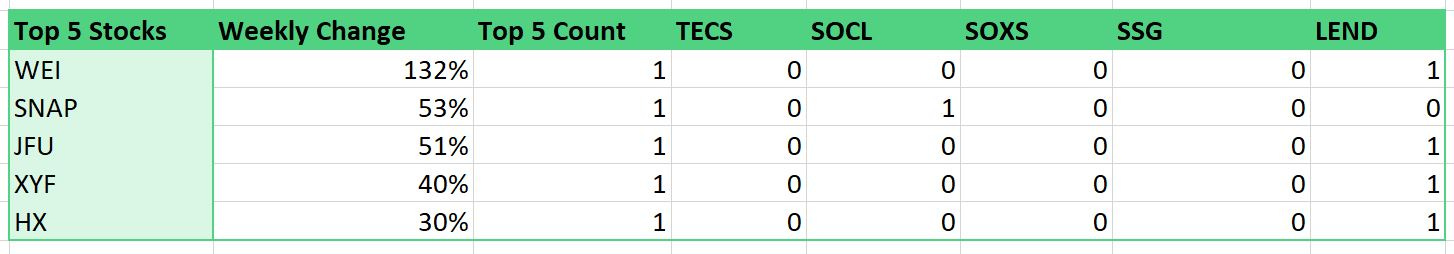
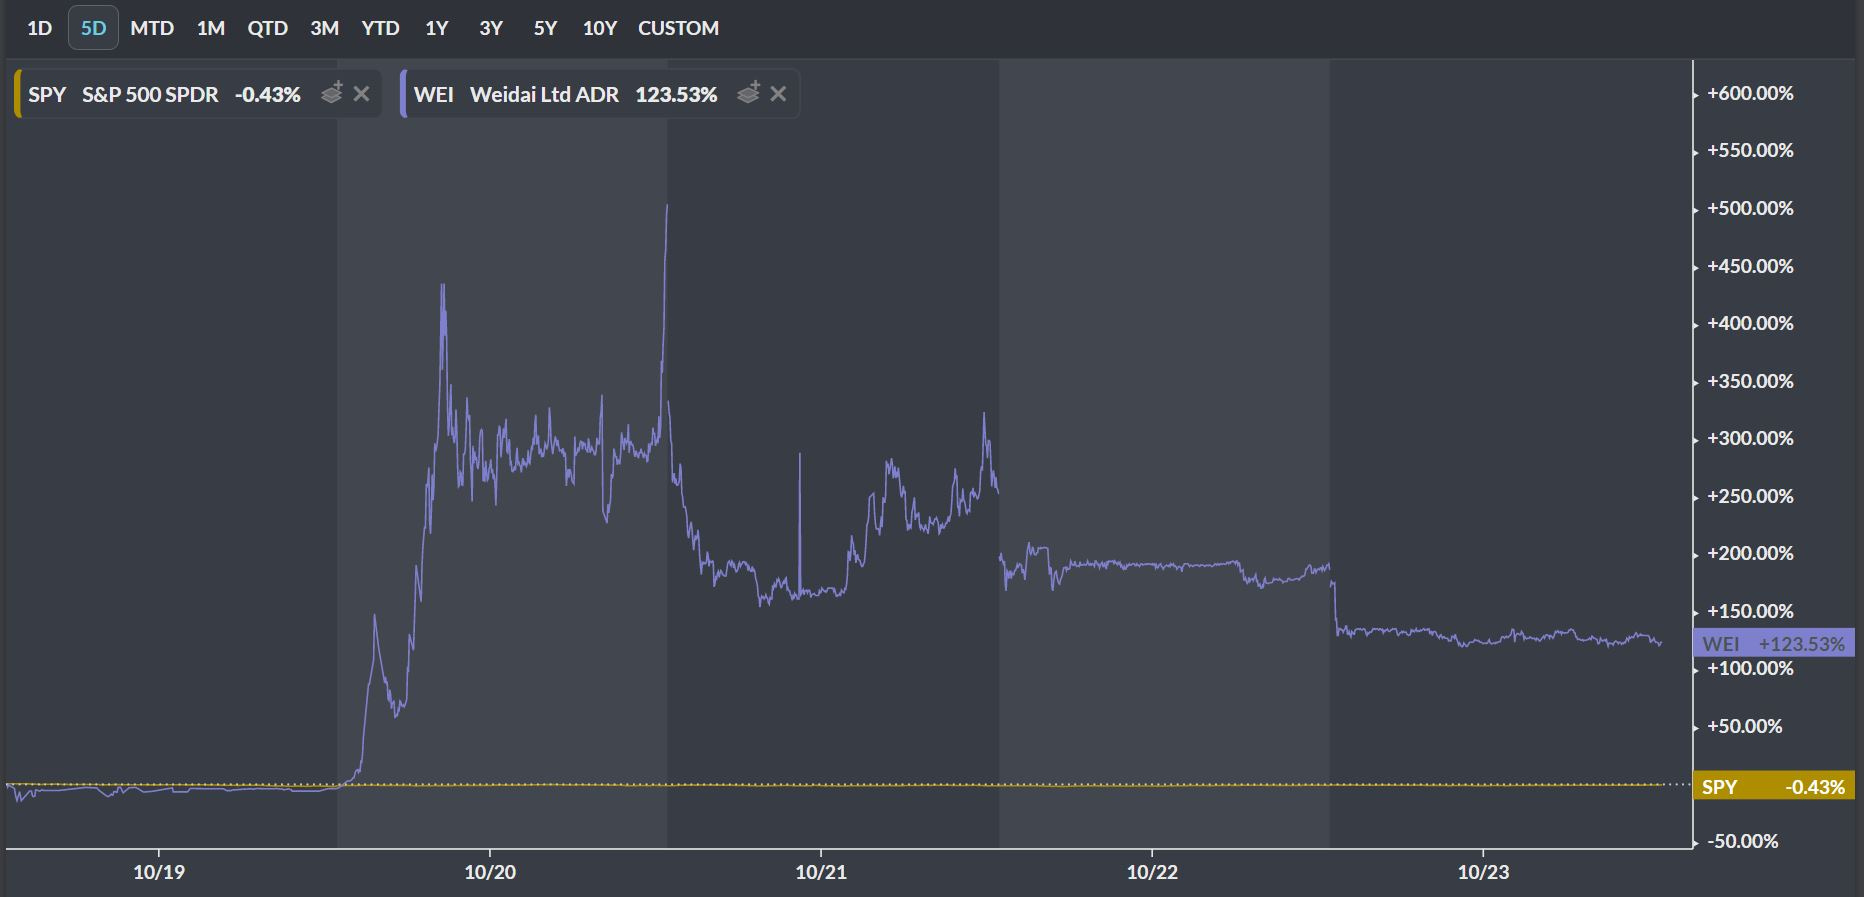
With $150m small cap $WEI (Weidai) a leading auto-backed financing solution provider in China, gaining at one point through the week 500%+ to end the week at “just” 132% up.
Year-To-Date:
Of the 107 ETFs which have been around YTD, the average return sits at a steady 26.79% . The S&P 500 ended the week with 7.66% YTD returns.
The top 5 constituents saw some minor changes after a steady week the week prior.
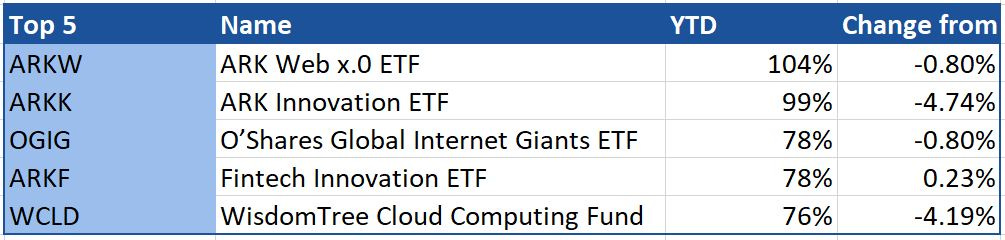
$ARKW and $ARKK once again traded places for the top spot YTD. $ARKW now is the sole Tech ETF with returns north of 100% for the year.
$WCLD fell from 3rd to 5th, switching places with $OGIG which moved from 5th to 3rd
$ARKF moved from 6th to 4th, pushing $CWEB out of the top 5.
On the bottom end of the table, despite some positive moves this week $LEND still found itself in the bottom 5, albeit some distance away from the Levered Bears which were at the top of the weeklies.
2015-to-2019:
To end this weeks email, I’ll leave you with an interesting set of ETFs which I found.
I looked at 2011 ETFs from 2015 - 2019. Surprisingly only the following amount outperformed the $SPY in a given year:
2015 321/2011 16%
2016 753/2011 37%
2017 844/2011 42%
2018 699/2011 35%
2019 308/2011 15%
While more have outperformed the S&P500 over the 5 year period, only 10 outperformed in EACH of those 5 years.
And they are…
$PSJ - Invesco Dynamic Software ETF
Expense Ratio: 0.58%
31 Holdings
Largest Holding = $SNAP at 5.91%

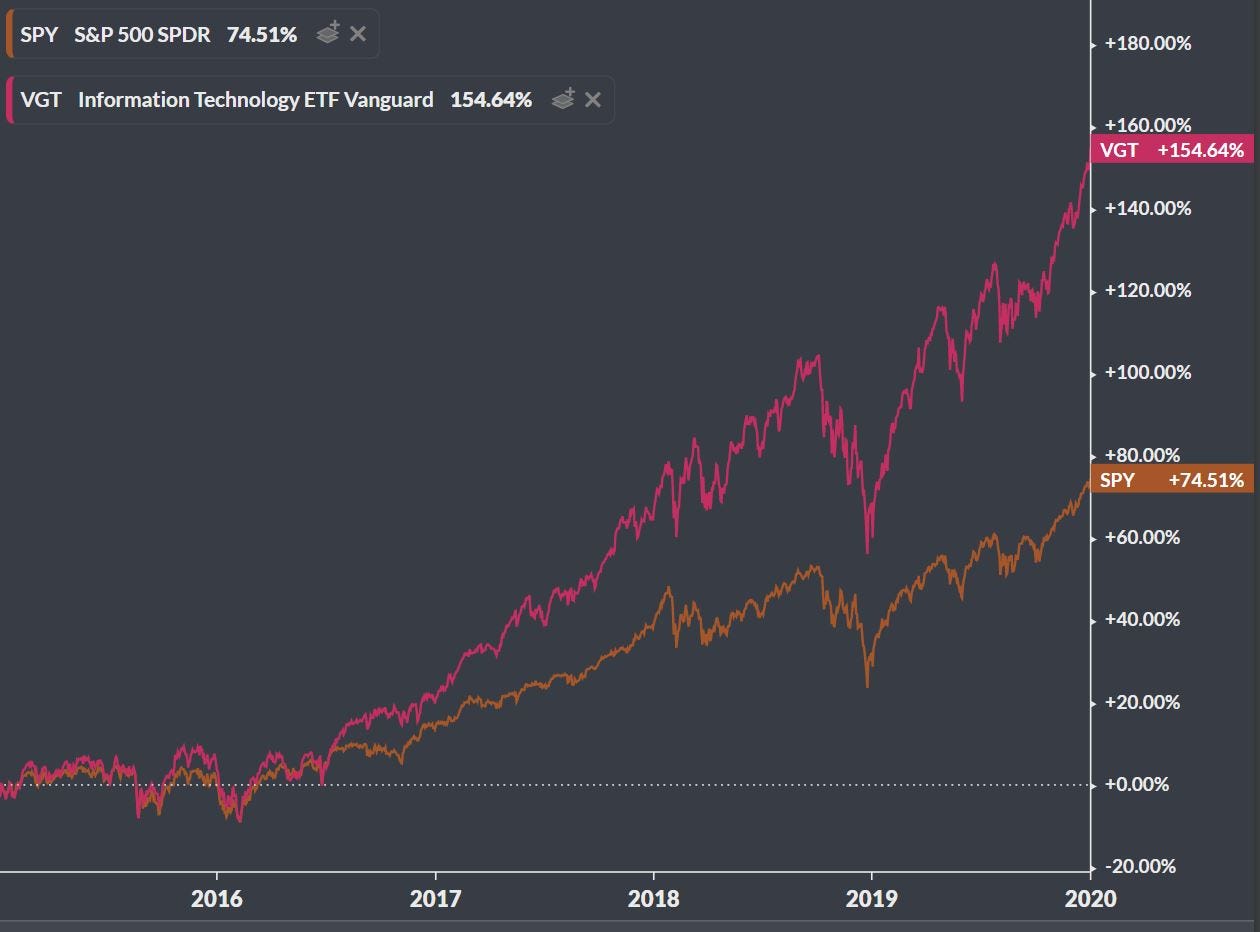
$VGT - Vanguard Information Technology ETF
Expense Ratio: 0.10%
327 Holdings
Largest Holding = $AAPL at 21.78%
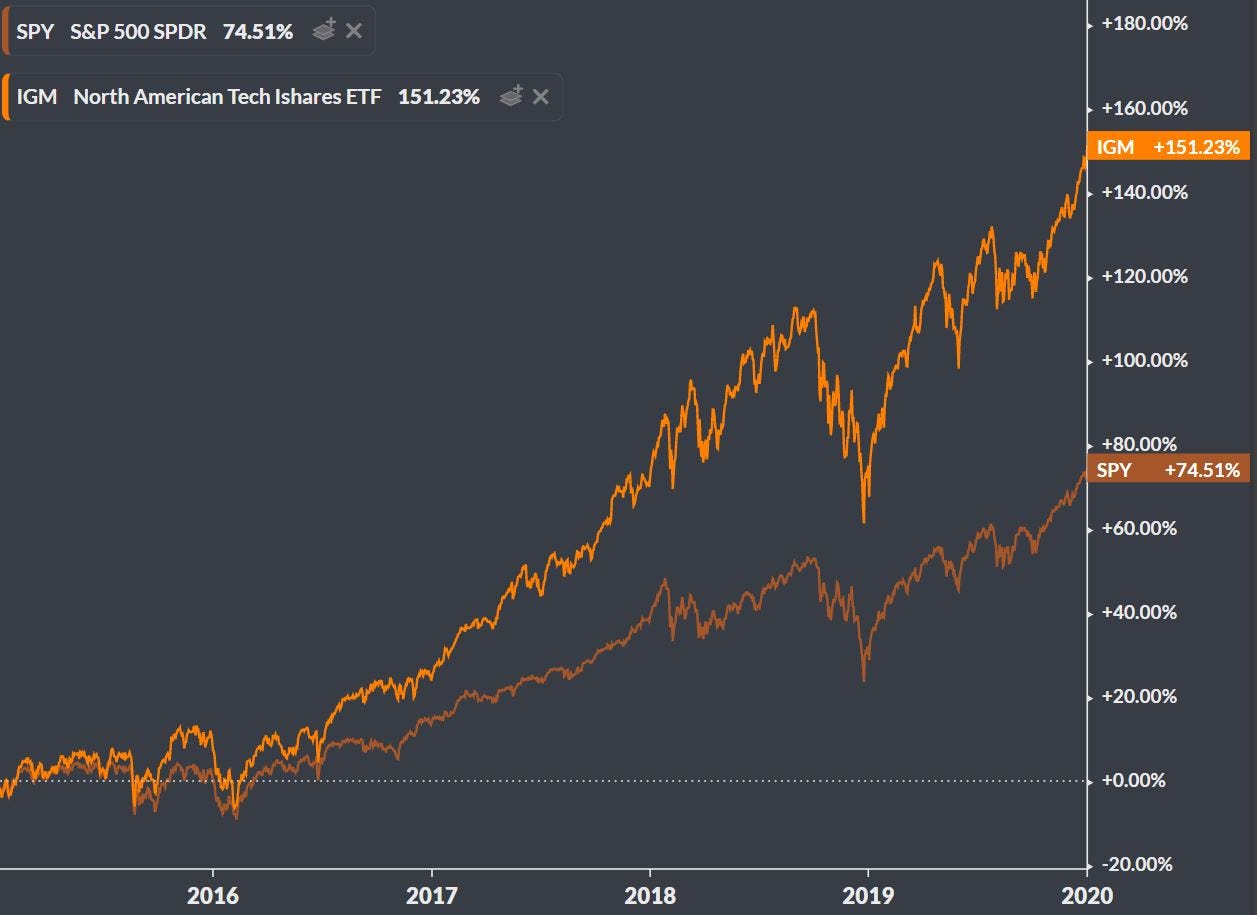
$IGM- iShares Expanded Tech Sector ETF
Expense Ratio: 0.46%
296 Holdings
Largest Holding = $MSFT at 8.44%
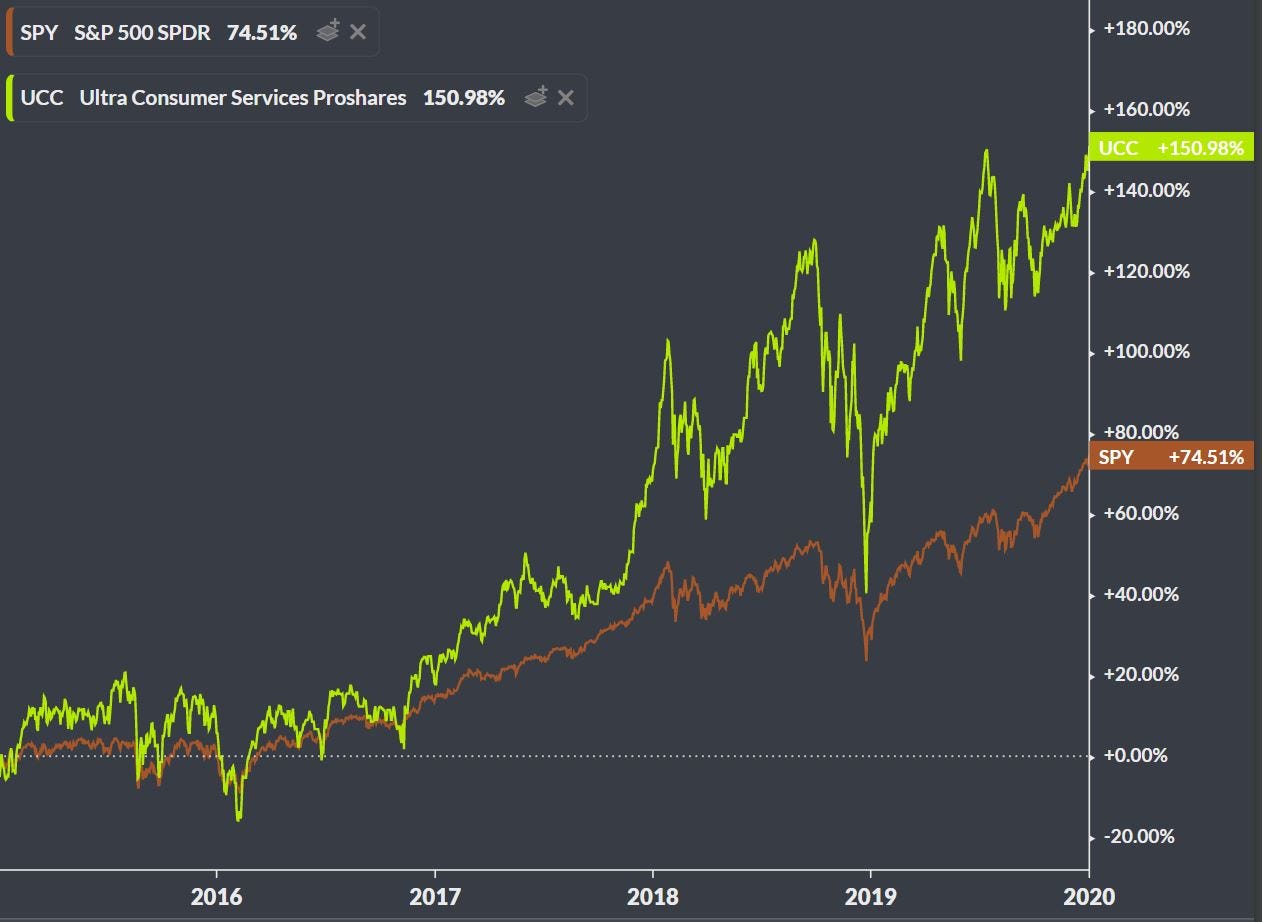
$UCC- ProShares Ultra Consumer Services
Expense Ratio: 0.95%
133 Holdings
Largest Holding = $AMZN at 28.59%
*This is a 2x daily leveraged ETF
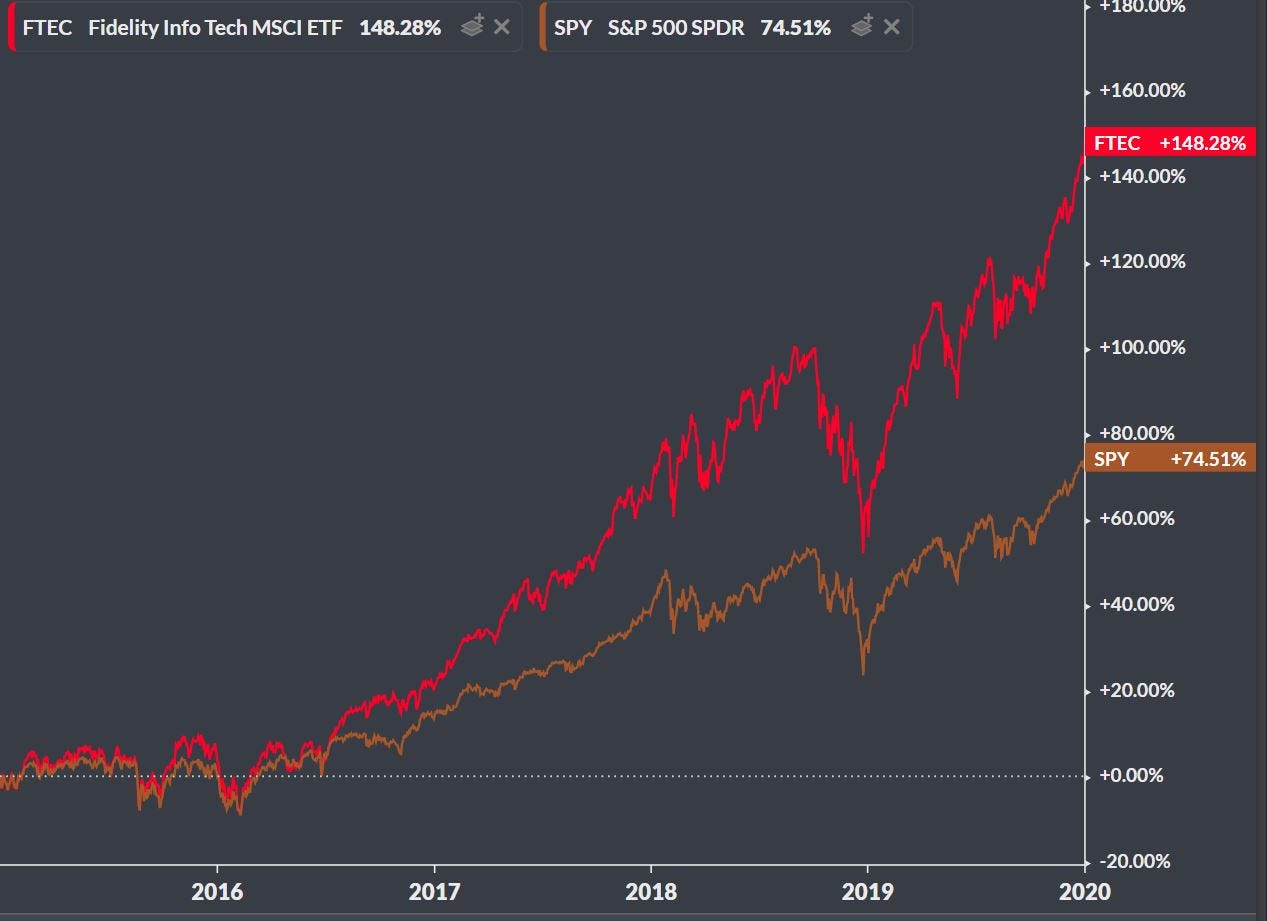
$FTEC- Fidelity MSCI Information Technology Index ETF
Expense Ratio: 0.08%
312 Holdings
Largest Holding = $AAPL at 21.76%
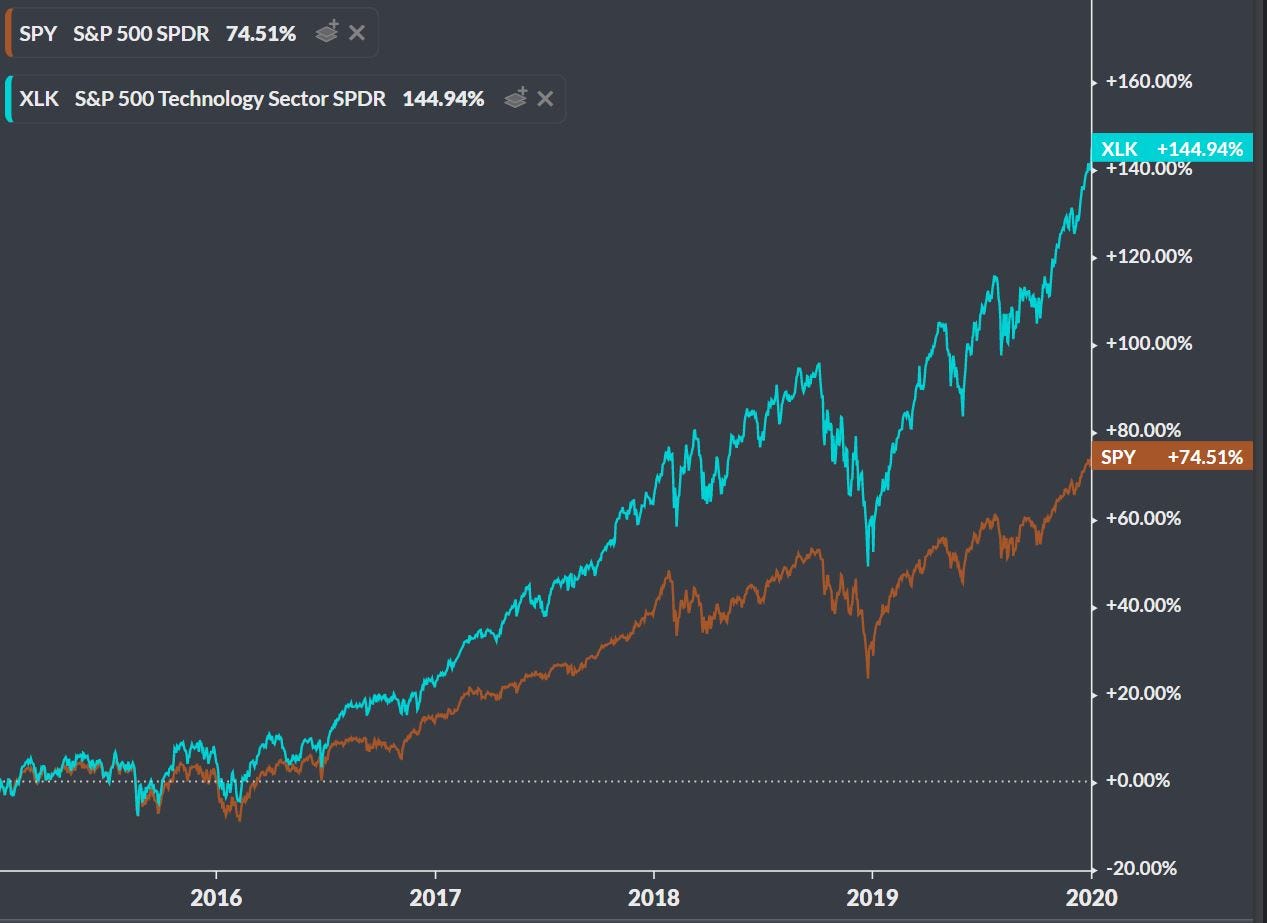
$XLK- Technology Select Sector SPDR Fund
Expense Ratio: 0.13%
73 Holdings
Largest Holding = $AAPL at 23.59%
$IHI- iShares U.S. Medical Devices ETF
Expense Ratio: 0.43%
64 Holdings
Largest Holding = $ABT at 13.97%

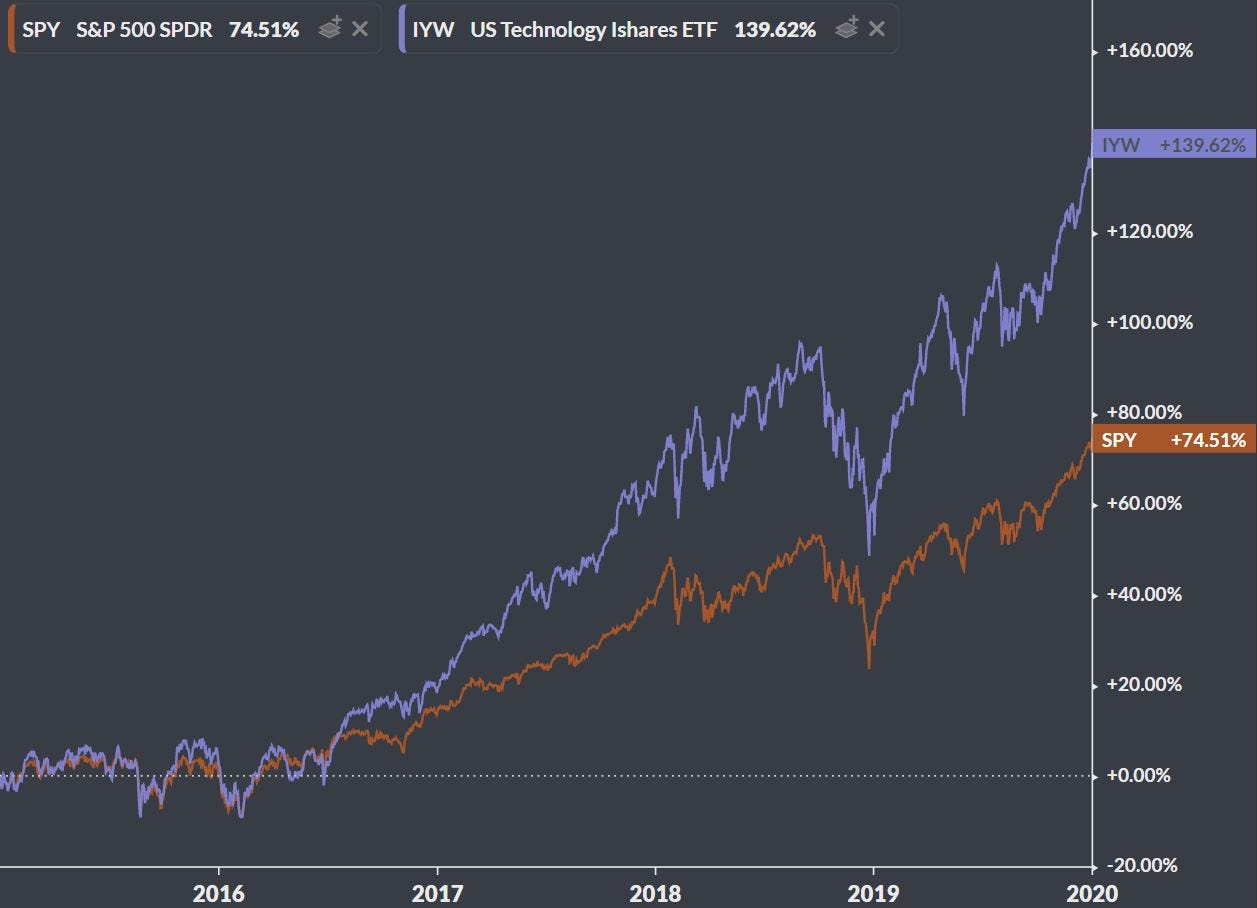
$IYW- iShares U.S. Technology ETF
Expense Ratio: 0.42%
158 Holdings
Largest Holding = $AAPL at 20.26%
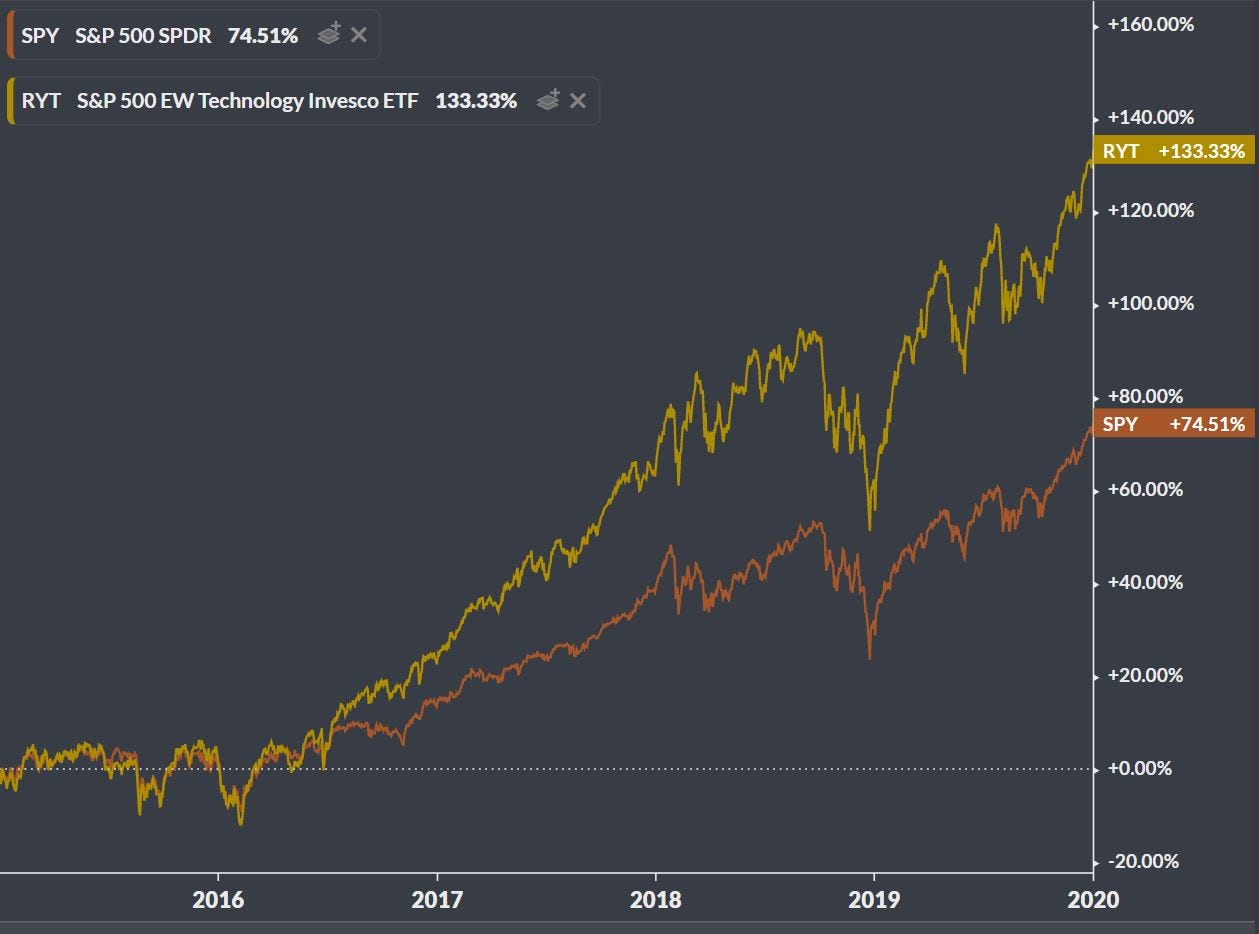
$RYT- Invesco S&P 500 Equal Weight Technology ETF
Expense Ratio: 0.40%
73 Holdings
Largest Holding = $LRCX at 1.54%
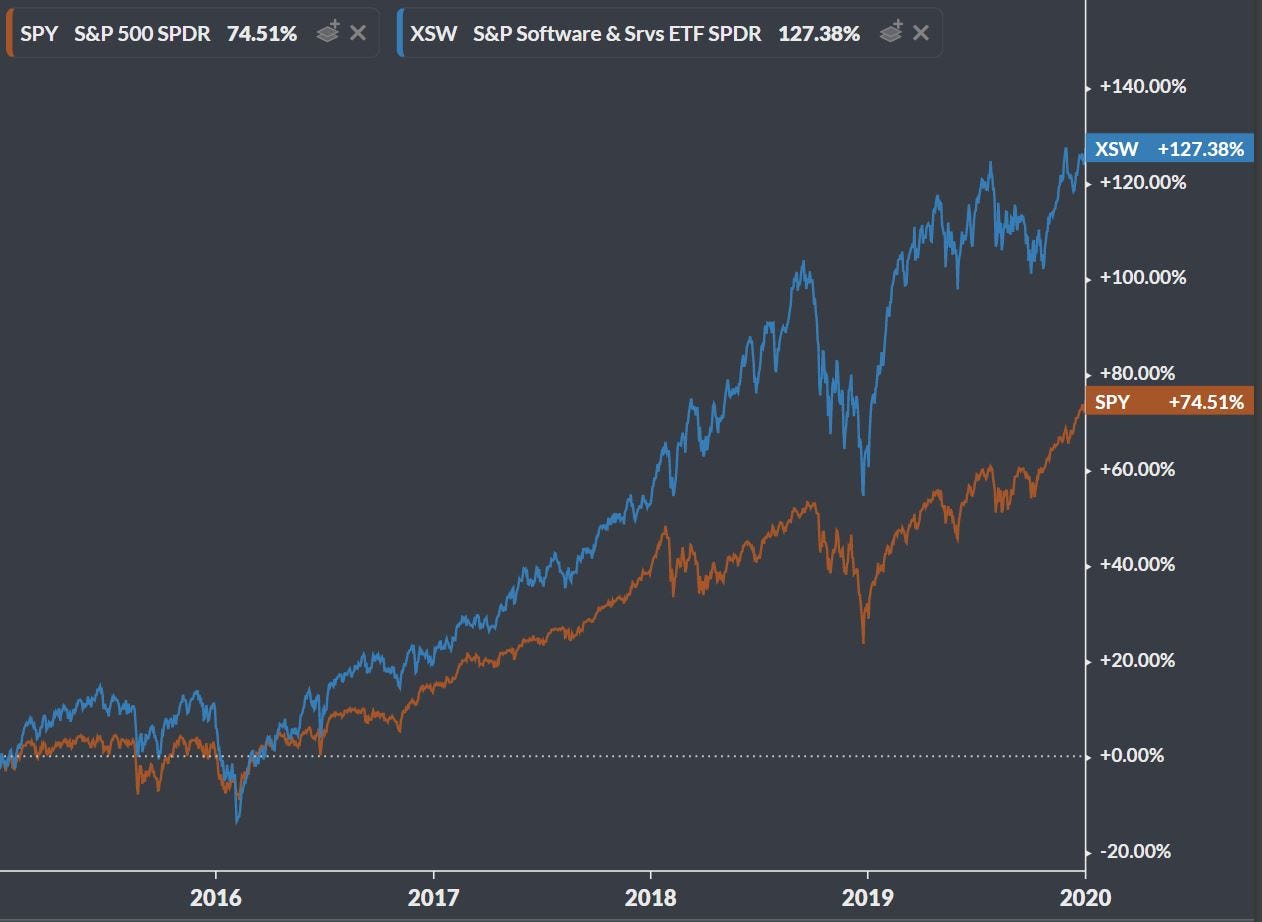
$XSW- SPDR S&P Software & Services ETF
Expense Ratio: 0.35%
170 Holdings
Largest Holding = $AVYA at 0.81%
Thanks again for reading, and see you all next week.
Stuart
Excellent recap. I didn’t know Snapchat hit an all time high and found that interesting.